Jython Debugging for ODI (revisited)


Over a year ago I wrote a two part (1, 2) post about ODI (Oracle Data Integrator) debugging using Eclipse. This post was meant to have at least one more part; somewhere along the way I gave up. It is not that is isn’t important, in fact I still continue to debug new processes for ODI written in Jython, but I gave up on Eclipse + PyDev when I found a better IDE (Integrated Development Environment).
PyCharm
PyCharm is billed as a “Python IDE for Professional Developers” and in my opinion it really lives up to that. PyCharm comes in two variants a free community edition or the professional edition. I personally liked the free version so much that I eventually paid for the full version.
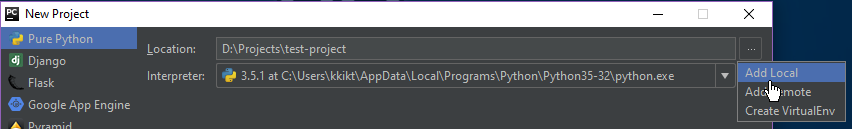
Create a Project
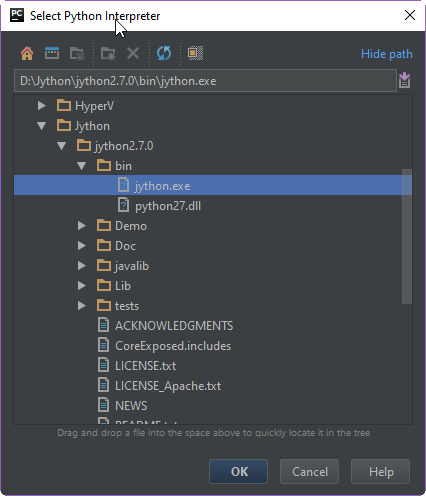
Creating a project involves two steps the first time out of the gate; once setup the first time the second step is not needed. First we define a project location. Next we add a python interpreter.
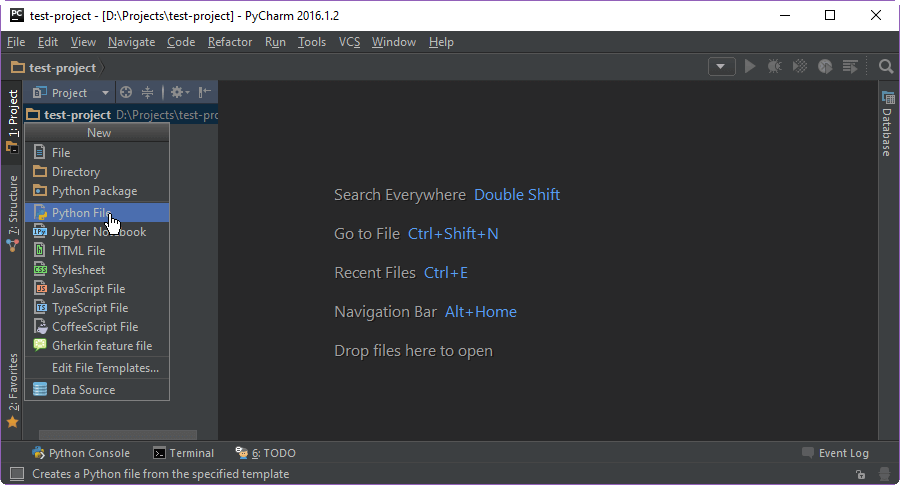
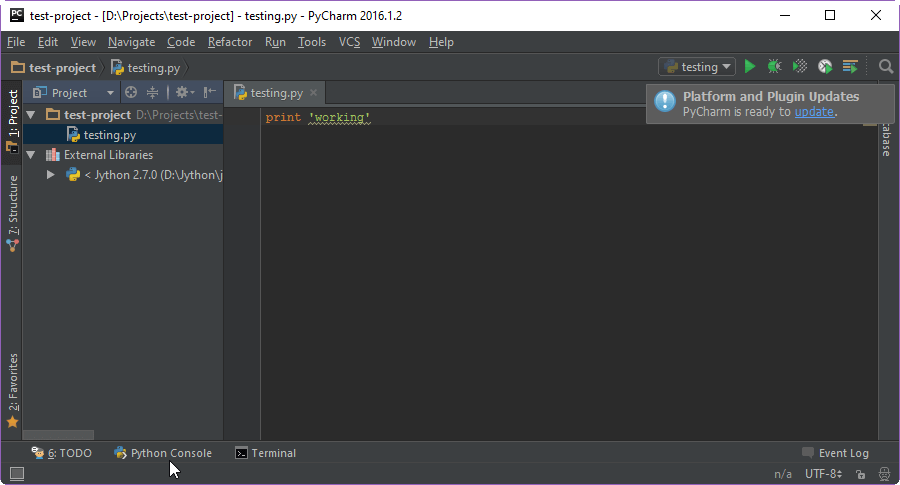
Create Script
Once the project has been created the next step is to add the code. In this case I created a file called testing and selected it to be a python file.
Once the file was created I added a single line of code print 'working'
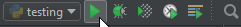
Run Script
With some code now written I clicked on the Run icon.
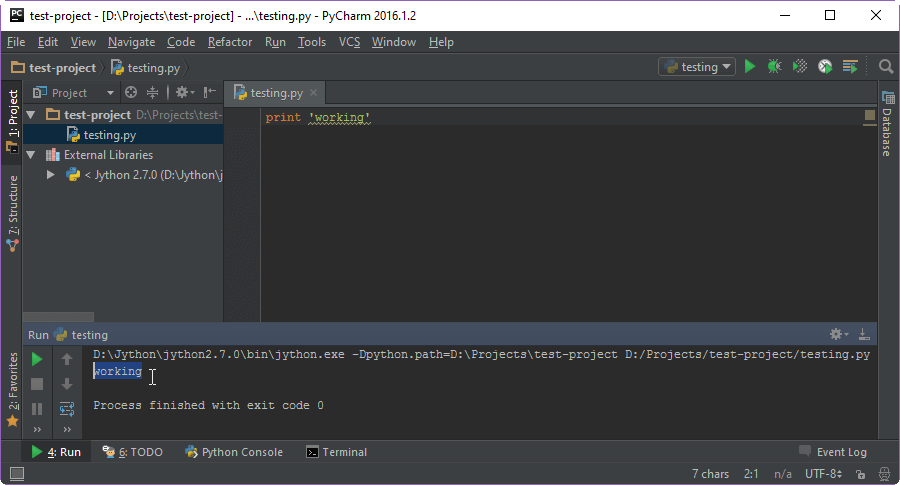
The results of the run show up in the Run panel.
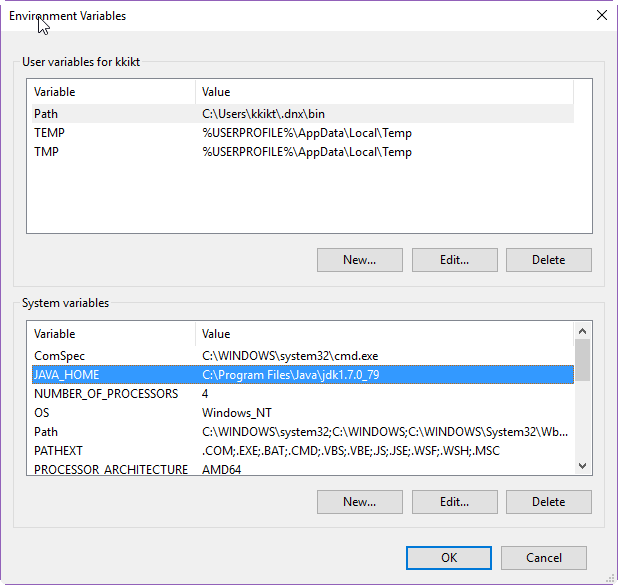
Issues
If you run into issues where the interpreter is "unknown" you may need to set the JAVA_HOME environment variable. On my machine I had to set JAVA_HOME to "C:\Program Files\Java\jdk1.7.0_79"
Prerequisite
Since PyCharm does not come with a Python or Jython interpreter one will need to be installed. For information on installing Jython please take a look at our post about Jython.